 https://www.omahamediagroup.com/images/uploads/monster_gallery/Omaha-Media-Group-Black.jpg
admin
https://www.omahamediagroup.com/images/uploads/monster_gallery/Omaha-Media-Group-Black.jpg
admin
What Is Web Analytics? A 2026 Guide for Marketers

TL;DR:
- Web analytics involves collecting, processing, and analyzing website data to understand user behavior and optimize marketing strategies. It answers key questions about visitor sources, actions, and goal completions, guiding data-driven decisions that improve revenue. Ensuring data accuracy through proper setup and integrating qualitative insights enhances the value of analytics as a strategic business tool.
Web analytics is defined as the systematic collection, measurement, and analysis of website data to understand user behavior and improve digital marketing performance. The practice answers three critical business questions: who visits your website, what they do once they arrive, and whether they complete the goals you set. Tools like Google Analytics, Adobe Analytics, and Hotjar sit at the center of this discipline. For business owners and marketing professionals, web analytics is not a reporting function. It is the operational foundation that separates revenue-generating decisions from expensive guesses.
What is web analytics and how does it work?
Web analytics follows five essential stages: data collection, processing, storage, analysis, and reporting. Each stage is necessary to convert raw website interactions into insights you can act on. Skip one stage and the entire system produces noise instead of signal.
Here is how each stage works in practice:
-
Data Collection. JavaScript tags embedded in your website pages fire each time a user loads a page or triggers an event. Google Analytics uses this method. The dominant collection method in 2026 is page tagging, which captures real-time interaction data including clicks, scroll depth, and form submissions. Server log file analysis is an older alternative that reads raw server records but lacks the real-time granularity modern marketers need.
-
Processing. Raw data arrives messy. The analytics platform filters, categorizes, and structures it. Sessions are assembled from individual hits. Traffic sources are attributed. Bot visits are flagged.
-
Storage. Processed data moves into a database or data warehouse. Platforms like Google Analytics 4 use Google’s BigQuery infrastructure for this purpose.
-
Analysis. This is where business questions get answered. You segment users by source, device, geography, or behavior. You build funnel reports. You compare cohorts over time.
-
Reporting. Data becomes visible through dashboards, scheduled reports, and visualizations. The biggest reporting hurdle is turning raw data into comprehensible outputs that guide real decisions, not just fill slides.
Pro Tip: Client-side tracking via browser scripts loses 10–40% of data due to ad blockers and privacy tools. Server-side tracking routes data through your own server before sending it to analytics platforms, recovering that lost accuracy and improving data integrity.
Why web analytics matters for business owners and marketers

Web analytics removes guesswork from marketing spend. Without it, you are allocating budget based on assumptions. With it, you know exactly which channels drive qualified traffic, which pages kill conversions, and where your funnel leaks revenue.
The core business benefits include:
- Conversion rate clarity. You see the exact percentage of visitors completing purchases, form fills, or calls. You can test changes and measure their direct impact.
- Traffic quality assessment. Not all traffic is equal. Analytics separates high-intent organic visitors from low-quality referral traffic, letting you cut spend on sources that do not convert.
- Return on ad spend (ROAS) measurement. You connect ad clicks to revenue outcomes. This is the difference between knowing a campaign “performed well” and knowing it returned $4.20 for every dollar spent.
- User experience optimization. Page-level data reveals where users drop off, which content holds attention, and which device types create friction.
- Marketing investment alignment. Analytics data feeds your digital marketing strategy with evidence, not opinion.
“Every decision made without measurement is a decision made blind.” — LatentView Analytics
The organizations that treat web analytics as a strategic discipline tied to business KPIs consistently outperform those that treat it as a technical checkbox. The data does not lie. Your interpretation of it determines whether you grow or stall.
What are the key web analytics metrics and how do you read them?
Metrics only matter when they connect to outcomes. The table below separates the metrics worth tracking from the ones that look impressive but tell you nothing useful.
| Metric | What It Measures | Why It Matters |
|---|---|---|
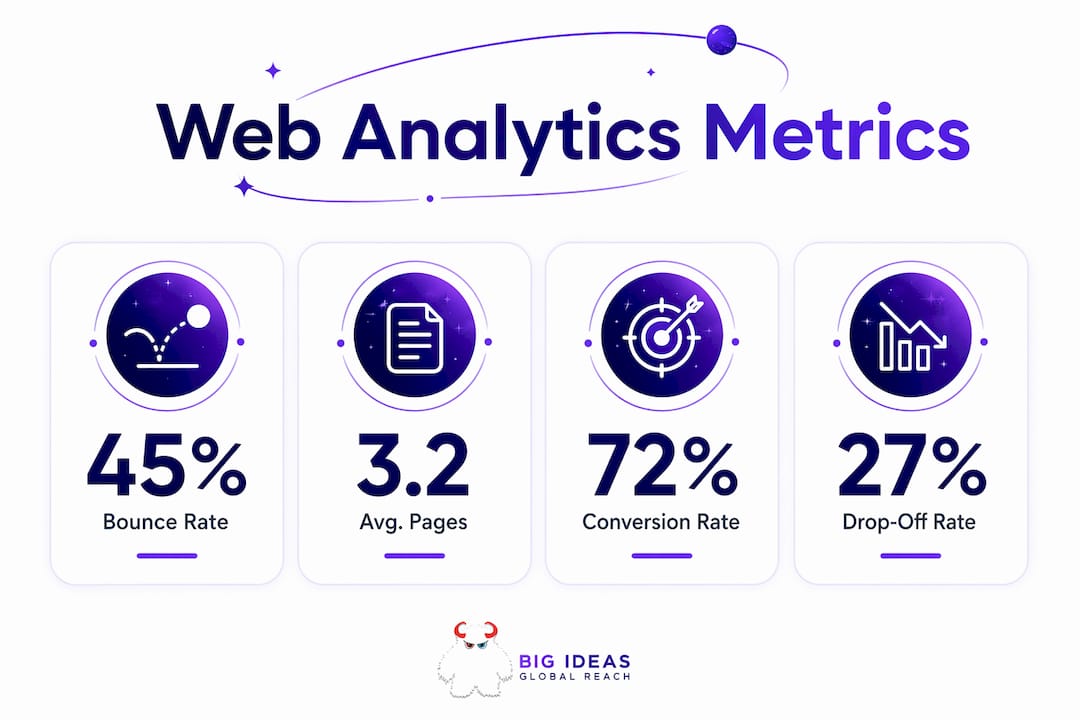
| Bounce Rate | Percentage of single-page sessions | High bounce on a landing page signals a message or UX mismatch |
| Session Duration | Average time users spend per visit | Longer sessions on product pages correlate with higher purchase intent |
| Conversion Rate | Percentage of visitors completing a goal | The clearest indicator of whether your site earns its traffic |
| Funnel Drop-Off Rate | Where users exit a multi-step process | Pinpoints the exact step losing you revenue |
| Unique Visitors | Distinct individuals visiting over a period | Measures true audience reach, not repeat session inflation |
Vanity metrics like total page views mislead teams into celebrating traffic that never converts. Successful teams focus on funnel drop-off points and user journey segments instead. That shift in focus is what separates analytics-driven growth from analytics-theater.
The distinction between macro-conversions and micro-conversions matters here. A macro-conversion is a completed purchase or a signed contract. A micro-conversion is a newsletter signup, a product page view, or a video play. Micro-conversions map the path users take before they buy. Ignoring them means you only see the end of the story, never the chapters where you lose people.
Cohort analysis takes this further. It groups users by the date they first visited or converted and tracks their behavior over time. This reveals whether a new campaign attracted buyers who returned or one-time visitors who never came back.
Pro Tip: Set up goal tracking in Google Analytics 4 for both macro and micro-conversions before you run any paid campaign. Without it, you are measuring impressions and clicks, not outcomes.
What are the common challenges in web analytics and how do you fix them?
Web analytics produces accurate insights only when the underlying data is clean. Most businesses skip this part and wonder why their numbers do not match reality.
The most common data quality problems include:
- Internal traffic contamination. Your own team browsing the site inflates session counts and distorts behavior metrics. Filter out office IP addresses in your analytics configuration.
- Cross-domain tracking gaps. If your checkout process lives on a separate domain, sessions break and attribution fails. Proper cross-domain tracking configuration is non-negotiable for e-commerce.
- Bot and spam traffic. Automated crawlers inflate page view counts. Enable bot filtering in your platform settings.
- Poor data hygiene. Without active data hygiene, key metrics like conversion rates can be distorted by 20–30%. That margin of error makes optimization decisions unreliable.
Privacy tools create a separate layer of challenge. Ad blockers and browser-level privacy features block client-side tracking scripts, creating gaps in your data. Server-side tracking implementations address this directly by moving data collection off the browser entirely.
The final challenge is the “what vs. why” gap. Quantitative analytics tells you what happened. It does not explain why. Pairing analytics with qualitative tools like heatmaps, session replays, and on-site surveys fills that gap. A heatmap showing users ignoring your call-to-action button explains the bounce rate your dashboard flagged. That combination of quantitative and qualitative data is where real optimization happens.
Web analytics best practices also require defining KPIs before you build your reports. Start with your business goal, work backward to the metric that measures progress toward it, then configure your tracking to capture that metric accurately. Most teams do this in reverse and end up drowning in data that does not connect to anything that matters.
Key takeaways
Web analytics produces revenue-driving decisions only when data collection is clean, metrics are tied to business goals, and quantitative data is paired with qualitative insight.
| Point | Details |
|---|---|
| Five-stage process | Web analytics runs through collection, processing, storage, analysis, and reporting in sequence. |
| Business questions answered | Analytics identifies who visits, what they do, and whether they convert, directly informing marketing ROI. |
| Metrics over vanity | Focus on conversion rate, funnel drop-off, and session quality rather than raw page view counts. |
| Data hygiene is non-negotiable | Unfiltered internal traffic and bot visits can distort conversion metrics by up to 30%. |
| Qualitative tools complete the picture | Heatmaps and session replays explain the “why” behind the behavioral data your analytics platform captures. |
The uncomfortable truth about web analytics most businesses miss
Most businesses install Google Analytics, watch the dashboard for a week, and then ignore it until something breaks. That is not analytics. That is a missed opportunity running on autopilot.
The teams I have seen extract real value from web analytics share one trait: they treat it as an operational system, not a reporting tool. They define KPIs before campaigns launch. They review funnel data weekly, not quarterly. They connect analytics output directly to budget decisions. When a traffic source stops converting, they cut it. When a page shows high drop-off, they test a fix within days, not months.
The other mistake I see constantly is organizational misalignment. Marketing pulls one set of numbers. The web team pulls another. Leadership sees a third. When your analytics data means different things to different departments, it stops driving decisions and starts driving arguments. A single source of truth, configured correctly and reviewed consistently, eliminates that friction.
One more thing worth saying directly: web analytics tied to SEO performance is where the compounding returns live. Organic traffic that converts at 4% is worth more than paid traffic converting at 1%, even if the paid volume is higher. Analytics makes that math visible. Most businesses never run it.
— Vector
How Monstrousmediagroup turns your analytics into revenue systems
If your analytics dashboard is full of data but short on decisions, that is a systems problem, not a data problem. Monstrousmediagroup builds analytics-driven marketing systems that connect website performance data directly to revenue outcomes. From configuring accurate tracking infrastructure to building reporting frameworks that your leadership team can actually use, every engagement is built around outcomes, not activity reports.

Your website infrastructure is the foundation of accurate data collection. If it is not built to support proper tagging, event tracking, and cross-domain attribution, your analytics will always be incomplete. Monstrousmediagroup designs and develops web infrastructure that supports the full analytics stack from day one. Contact Monstrousmediagroup to build a measurement system that stops revenue leaks and drives growth you can see in the numbers.
FAQ
What is web analytics in simple terms?
Web analytics is the process of collecting and analyzing data about how people use your website. It tells you who visits, what they do, and whether they complete your business goals.
What are the main web analytics tools available in 2026?
Google Analytics 4, Adobe Analytics, and Hotjar are among the most widely used platforms. Each serves different needs, from basic traffic reporting to advanced behavioral analysis and session replay.
How does web analytics improve conversion rates?
Web analytics identifies where users drop out of your conversion funnel and which traffic sources produce buyers. That data lets you fix friction points and reallocate budget to channels that convert.
What is the difference between a bounce rate and a drop-off rate?
Bounce rate measures single-page sessions where users leave without interacting further. Drop-off rate measures where users exit during a multi-step process like a checkout or lead form.
How do you maintain data accuracy in web analytics?
Filter internal traffic by IP address, configure cross-domain tracking for multi-domain sites, enable bot filtering, and consider server-side tracking to recover data lost to ad blockers. Clean data is the prerequisite for reliable decisions.
Recommended
Hire the team to help you with your website, app, or other marketing needs.
We have a team of digital marketers who can help plan and bring to life all your digital marketing strategies. They can help with social media marketing, email marketing, and digital advertising!
CONTACT US
Comments