
Landing page testing is the practice of running controlled experiments on a landing page to determine which version produces more conversions, revenue, or qualified leads. To start today: set a specific conversion goal in GA4, write a single evidence-based hypothesis, then run an A/B test that changes one element at a time.
- Set your goal first. Define the primary metric before touching the page. Conversion rate, revenue per visitor, or form completion rate - pick one and lock it in GA4.
- Write a hypothesis with evidence. Pull data from Microsoft Clarity session recordings or heatmaps to identify where visitors drop off, then state what you expect to change and why.
- Run a single-element A/B test. Change one thing per variant. Use a sample size calculator to confirm you have enough traffic before you launch.
Pro Tip: Most teams skip the sample-size check and call a winner after 200 visits. That is the single most common reason test results fail to hold when the variant goes live.
Key Takeaways
Systematic landing page testing compounds when results feed revenue systems - not when they sit in a spreadsheet.
| Point | Details |
|---|---|
| Start with goal and sample size | Define your primary metric and calculate required traffic before building any variant. |
| Test high-leverage elements first | Headline, offer match, and CTA copy move conversion rates more than visual or cosmetic changes. |
| Qualitative data sharpens hypotheses | Session recordings and heatmaps from tools like Microsoft Clarity explain why variants win or lose. |
| Document every test in a registry | A test registry with hypothesis, result, and next step turns experiments into a compounding roadmap. |
| Monstrousmediagroup operationalizes the handoff | MMG connects winning test results to ad creative, lead routing, and marketing automation systems. |
Table of Contents
- What types of landing page tests should you run?
- How do you plan, run, and validate a landing page test?
- Which landing page elements actually move the needle?
- What metrics should you track and how do you analyze results?
- How do heatmaps and session recordings improve your test hypotheses?
- Which tools should you use for landing page testing?
- How do you prioritize tests and write hypotheses that hold up?
- What mistakes invalidate landing page test results?
- Pre-launch and post-launch checklist for every experiment
- How do you turn test results into repeatable revenue infrastructure?
- Where does landing page testing actually drive the most ROI?
- Monstrousmediagroup builds the systems behind your test results
- Authoritative resources for deeper study
- Sources
What types of landing page tests should you run?
Not every test design fits every situation. Choosing the wrong structure wastes traffic and produces results you cannot act on.
A/B test (single-variable): Two versions, one change. The right choice for most teams, most of the time. Use it when you have a clear hypothesis and enough traffic to reach significance on one metric.
A/B/n test: Three or more variants tested simultaneously. Useful when you have multiple strong hypotheses for the same element and enough volume to split traffic without starving any variant.
Multivariate test (MVT): Tests combinations of changes across multiple elements at once. Requires substantially more traffic than A/B because each combination needs its own sample. Reserve MVT for high-volume pages where you need to understand interaction effects between elements.
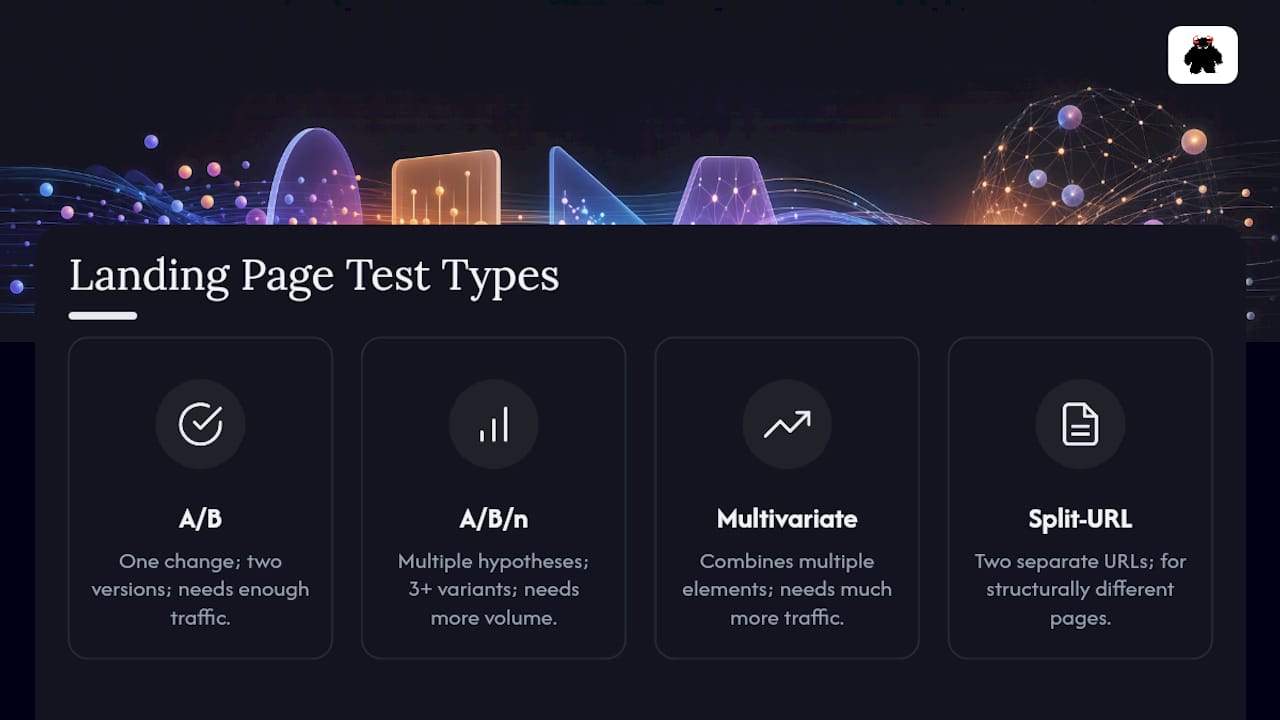
Split-URL test: Two entirely separate page URLs receive split traffic. The best option when variants differ so significantly that editing within a single page editor is impractical - a full layout redesign, for example.
Personalization experiments: Serve different content to different audience segments based on source, behavior, or demographic. This is not a replacement for structural experiments; it layers on top of a proven base variant.
Client-side vs. server-side splits matter more than most teams realize. Client-side tools inject variant code after the page loads, which can cause visual flicker and add render-blocking scripts. Server-side splits route traffic before the page renders, eliminating flicker and protecting page speed. For full-page variant tests on paid campaigns, server-side splitters or smart short links avoid the performance overhead that client-side enterprise CRO scripts introduce.
The rule of thumb: match test complexity to traffic volume. A/B for most pages, MVT only when you have thousands of conversions per month, and split-URL when variants are structurally different enough to require separate builds.
How do you plan, run, and validate a landing page test?
A repeatable process prevents the most common failure modes: testing without a goal, calling winners too early, and losing institutional knowledge when a team member leaves.
- Define the business goal and primary metric. Revenue per visitor or qualified lead rate is more durable than raw conversion rate. Secondary metrics (bounce rate, form starts, time on page) provide diagnostic context but should not drive the go/no-go decision.
- Identify the problem with evidence. Use analytics data, heatmaps, and session recordings to locate the highest-friction element. A practical testing plan answers three questions: what problem are we seeing, what change will fix it, and which metric will prove it, per Leadpages’ testing framework.
- Write a structured hypothesis. Format: “We believe changing [element] from [A] to [B] will improve [metric] for [audience] because [evidence].” Include expected effect size and your stopping criteria in the hypothesis document.
- Calculate required sample size before setup. Use the inputs Evan Miller’s calculator requires: baseline conversion rate, minimum detectable effect (MDE), confidence level (typically 95%), and statistical power (typically 80%). Smaller MDEs require dramatically more traffic. A page converting at 3% that you want to detect a 0.5-percentage-point lift on needs far more visitors than one converting at 10% where you expect a 2-point lift.
- Set up and QA the test. Run an A/A test first to confirm your tracking fires correctly and that the two identical variants produce statistically similar results. Verify tracking in GA4, check cross-device rendering, and lock the variant so no one edits it mid-test.
- Run to the predetermined endpoint. Per Harvard Business Review’s analysis of online experiments, peeking at results before the predetermined sample size is reached inflates false positives significantly. Set a minimum run time of two full business cycles (typically two weeks) regardless of early signals.
- Analyze, segment, and decide. Check statistical significance, then segment results by device, traffic source, and geography before declaring a winner. A result that holds across segments is far more reliable than one driven by a single device type.
- Document and implement. Log the test in your test registry with hypothesis, result, date, owner, and next step. Implement the winner and feed the insight into your next hypothesis.
Stopping rules: if a variant shows clear harm (conversion rate drops more than 20% with high confidence), stop early. If results are flat after twice the required sample size, call it inconclusive and move on.
Pro Tip: Run your A/A test for a substantial number of sessions per variant to ensure tracking accuracy before a real test. If the two identical versions show a statistically significant difference, your tracking or traffic split is broken - fix it before running any real test.
Which landing page elements actually move the needle?
PulseCRO’s testing hierarchy recommends testing headline first, then CTA, social proof, form friction, and layout - in that order - because testing lower-leverage items first wastes test capacity. Here is how that plays out in practice:
- Offer and message match: The single highest-leverage variable. If your ad promises one thing and your page delivers another, no headline test will fix it. Align the offer language first.
- Headline: The first thing visitors read and the element with the largest expected effect size. Test value proposition framing, specificity, and urgency.
- Primary CTA copy and placement: “Get My Free Quote” consistently outperforms “Submit” in directional tests. Placement above the fold versus after social proof is worth testing separately.
- Form friction: Reducing field count, changing field labels, or replacing a form with a phone number can move conversion rates substantially on high-intent pages.
- Social proof: Test the format (logos vs. testimonials vs. review counts), placement (above vs. below the fold), and specificity of claims.
- Incentive: A free resource, trial, or guarantee can shift conversion rate more than any visual change.
- Hero image or video: Lifestyle imagery versus product screenshots versus no image at all. On low-traffic pages, this is a directional test - you are looking for a signal, not a precise lift estimate.
- Above-the-fold layout: The arrangement of headline, subhead, CTA, and trust signals. This is a split-URL test candidate because the change is structural.
For low-traffic pages, run bigger directional tests (offer, message match, full layout) rather than element-level tweaks. Use qualitative data from session recordings to compensate for statistical limits. The Contentful A/B testing guide reinforces this: test headlines, layout, CTAs, images, forms, and proof - but sequence them by expected impact.
Do not overlook the thank-you page. Post-conversion flows (upsell offers, referral prompts, next-step CTAs) are part of the experiment scope and often easier to test because the audience is already converted and self-selected.
For additional landing page test ideas across these categories, Knak’s curated list covers a wide range of options worth filtering by your traffic capacity and business priority.
What metrics should you track and how do you analyze results?
Primary metrics drive the go/no-go decision: conversion rate, revenue per visitor, and lead quality score (if your CRM supports it). Revenue per visitor is more durable than conversion rate alone because a variant that converts more but attracts lower-quality leads can hurt downstream revenue.
Secondary metrics provide diagnostic context: click-through rate on the CTA, form start rate, form completion rate, time on page, and bounce rate. A drop in form completion rate with a flat overall conversion rate suggests the variant attracts more clicks but creates friction at the form.
Interpreting segmentation before declaring a winner
Always segment results by device type, traffic source, and geography before calling a winner. A variant that wins on desktop but loses on mobile is not a winner - it is a segmentation problem. Traffic source segmentation matters equally: a paid search audience and an organic audience often respond differently to the same headline change.

Statistical significance and sample size
Statistical significance at 95% confidence means there is a 5% probability the observed difference is due to chance. That sounds rigorous, but it is not sufficient on its own. You also need adequate statistical power (typically 80%) to detect the minimum effect size you care about. Evan Miller’s sample size calculator takes baseline conversion rate, MDE, confidence, and power as inputs and returns the required visitors per variant. Run this calculation before setup, not after.
| Metric | Primary or Secondary | Decision Rule |
|---|---|---|
| Conversion rate | Primary | Declare winner at 95% confidence, minimum sample met |
| Revenue per visitor | Primary | Use when AOV or lead quality varies between variants |
| Form start rate | Secondary | Diagnose CTA or above-fold friction |
| Form completion rate | Secondary | Diagnose form-level friction |
| Bounce rate | Secondary | Flag if variant drives higher exits before engagement |
| Time on page | Secondary | Context only - not a conversion proxy |
How do heatmaps and session recordings improve your test hypotheses?
Quantitative test results tell you what happened. Qualitative tools tell you why. The two are not interchangeable, and the teams that skip qualitative analysis consistently generate weaker hypotheses.
- Use session recordings before writing a hypothesis. Microsoft Clarity session recordings reveal where visitors hesitate, which sections they skip, and where rage-clicks cluster. A headline that loses an A/B test but shows high scroll depth suggests the problem is below the fold, not in the headline itself.
- Use heatmaps to validate surprising results. If a variant with a shorter form converts less than expected, a click heatmap may show visitors clicking a field that does not exist in the variant - a UX confusion issue, not a copy issue.
- On-page surveys fill explanatory gaps. A single exit-intent question (“What stopped you from completing this today?”) can surface objections that no heatmap will reveal. Tools like Hotjar support this natively.
- Micro-interviews close the loop. Five 15-minute user interviews with recent converters and recent abandoners will surface more hypothesis material than a month of heatmap analysis alone.
A practical workflow: run Clarity recordings for two weeks on the control page, identify the top three friction points, then write hypotheses that address each. This sequence produces higher-confidence tests than brainstorming from a blank page.
Which tools should you use for landing page testing?
The right tool depends on your traffic volume, technical stack, and whether you need a visual editor or server-side control.
- Unbounce: A no-code landing page builder with built-in A/B testing. Best for teams that build and test pages without developer support. Integrates with GA4, HubSpot, and most tag managers.
- VWO (Visual Website Optimizer): A full CRO platform covering A/B, MVT, split-URL, and personalization. Strong for mid-market teams that need a visual editor plus session recordings in one tool.
- Optimizely: Enterprise-grade experimentation platform with server-side testing, feature flags, and advanced statistical models. Best for organizations running dozens of concurrent experiments across web and product.
- Crazy Egg: Heatmaps, session recordings, and A/B testing in a single lightweight tool. The Crazy Egg operational checklist covers the full setup sequence from CRO audit through A/A test to analysis.
- Hotjar: Session recordings, heatmaps, and on-page surveys. The strongest qualitative complement to any A/B testing platform.
- Microsoft Clarity: Free session recording and heatmap tool from Microsoft. No traffic limits, integrates directly with GA4, and requires no additional tag manager configuration beyond a single script.
- Google Analytics (GA4): The analytics backbone for every test. GA4’s Explorations and conversion event tracking provide the primary metric data that feeds every test decision.
Pro Tip: You do not need an enterprise platform to run valid tests. Add VWO or Optimizely when you outgrow visual editors or need server-side control.
Integration checklist before launch: confirm GA4 conversion events fire on both variants, verify your CRM receives lead data from both variants, check that your tag manager does not fire duplicate events, and confirm the test does not interfere with any active personalization rules.
For teams running paid campaigns where page speed is a direct quality score factor, server-side splits or short-link redirects protect performance better than client-side DOM-swap tools. Aligning your PPC strategy with the right test infrastructure prevents the scenario where your experiment tool degrades the very page experience you are trying to improve.
How do you prioritize tests and write hypotheses that hold up?
Most teams have more test ideas than traffic. A prioritization rubric prevents the common failure of testing whatever is easiest rather than whatever matters most.
Impact × Confidence × Ease (ICE) scoring: Rate each test idea on a 1–10 scale for each dimension, then multiply. Impact reflects expected effect on the primary metric. Confidence reflects the strength of evidence supporting the hypothesis. Ease reflects implementation effort. A headline test with strong heatmap evidence scores higher than a button color test with no supporting data, even if the button test is easier to build.
- Assign impact scores from analytics data. A page with a 60% mobile bounce rate and no mobile-optimized CTA has a high-impact mobile layout test waiting. A page with strong scroll depth but low form completion has a high-impact form friction test.
- Assign confidence scores from qualitative signals. Session recordings, survey responses, and user interview findings raise confidence. A hypothesis with no qualitative backing gets a low confidence score regardless of how intuitive it feels.
- Use the hypothesis template consistently. “We believe changing [element] from [A] to [B] will improve [metric] for [audience] because [evidence].” Add expected effect size and stopping criteria. A hypothesis without a stopping criterion is not a hypothesis - it is a wish.
Pro Tip: Include the minimum detectable effect in every hypothesis document. It prevents teams from calling a 0.3-point lift a success when the business case required ten times that.
What mistakes invalidate landing page test results?
The most expensive testing mistakes are invisible until you try to replicate the result.
- Peeking at results early. Checking significance before the predetermined sample size is reached inflates false positives. Harvard Business Review’s research on online experiments identifies this as a primary cause of unreliable test outcomes. Set the endpoint before launch and do not adjust it.
- Changing a variant mid-test. Any change to a live variant invalidates the data collected before the change. Lock variants at launch.
- Running overlapping tests on the same page. Two simultaneous tests on the same page create interaction effects that make both results uninterpretable. One test per page at a time.
- Ignoring segmentation. A result that holds on desktop but reverses on mobile is not a winner. Always segment before declaring.
- Testing during abnormal traffic periods. A test that runs over a major sale event, a viral social post, or a Google algorithm update captures an audience that does not represent your normal visitor mix. Pause tests during known anomalies.
- SEO risks during split tests. Client-side DOM-swap tools can cause Googlebot to see inconsistent content across crawls. Use canonical tags correctly, avoid cloaking (serving different content to bots than to users), and prefer server-side splits or short-link redirects for full-page tests to protect page experience signals.
- Novelty effects. A new variant sometimes lifts conversions simply because it is new. If a winner’s lift decays significantly in the two weeks after rollout, the original result may have been a novelty effect. Extend test duration to at least two full business cycles to reduce this risk.
Pre-launch and post-launch checklist for every experiment
Running through a structured checklist before and after each test prevents the operational errors that waste traffic and produce invalid data.
Pre-launch:
- Confirm GA4 conversion events fire correctly on both the control and variant.
- Run an A/A test for at least 1,000 sessions per variant to verify tracking integrity.
- Calculate required sample size using baseline conversion rate, MDE, confidence (95%), and power (80%).
- QA both variants on desktop, mobile, and tablet.
- Check page load speed on both variants - image optimization and script load order affect both performance and test validity.
- Confirm no other active tests are running on the same page.
- Set the predetermined run time and sample-size endpoint in writing.
During the test:
- Monitor traffic volume daily for the first three days to catch tracking failures early.
- Check for anomalous traffic spikes (bot traffic, viral referrals) that would contaminate the sample.
- Do not look at conversion results until the predetermined endpoint.
Post-test:
- Segment results by device, source, and geography before declaring a winner.
- Review secondary metrics for diagnostic signals.
- Implement the winner and document the result in the test registry.
- Write the next hypothesis based on what the test revealed.
Pro Tip: Build your test registry as a shared spreadsheet with columns for: test ID, page URL, hypothesis, start date, end date, sample size, result, confidence level, segments reviewed, and next step. This document becomes your CRO roadmap.
How do you turn test results into repeatable revenue infrastructure?
A single winning test is a tactic. A documented test registry fed into your marketing automation stack is infrastructure. The distinction determines whether your CRO program compounds or stalls.
When a variant wins, the result should trigger actions beyond updating the landing page. Feed winning message frames into ad creative. Update lead routing rules if the winning variant attracts a different audience segment. Adjust email nurture sequences to match the language that converted. Monstrousmediagroup’s marketing automation services are built to operationalize exactly this handoff - connecting experiment outcomes to campaign flows and lead scoring without manual intervention.
Pro Tip: Assign every test an owner who is responsible for the post-test handoff. A winning variant that sits unimplemented for three weeks while the team debates the next test is a revenue leak, not a CRO program.
| Experiment Outcome | Revenue System Action |
|---|---|
| Variant wins on conversion rate | Update live landing page, push winning copy to ad creative |
| Variant wins on lead quality | Adjust lead scoring threshold, update CRM routing rules |
| Variant loses, reveals friction point | Feed friction finding into next hypothesis, update nurture sequence |
| Inconclusive result | Document as background data, increase MDE for next test on same element |
Where does landing page testing actually drive the most ROI?
The honest answer is that systematic testing is not the right first investment for every business.
That is the ROI case for testing. It is a revenue protection argument, not a growth-hacking argument.
The scenario where testing is the wrong first move: your tracking is broken, your page loads in six seconds on mobile, or your funnel has a structural misalignment between ad promise and page offer. No A/B test fixes a broken analytics setup or a page that Google’s Core Web Vitals flags as poor. Fix the infrastructure first. A test built on bad tracking data produces confident wrong answers.
For in-house versus agency-managed experimentation, the decision comes down to two factors: traffic volume and testing cadence. Teams running fewer than five tests per month and generating under 10,000 monthly page visits rarely justify a dedicated CRO hire. The more practical path is a managed experimentation engagement where test governance, statistical rigor, and implementation are handled by a team that runs experiments daily. The cost of a false positive that sends a losing variant to production - and the revenue lost during the weeks it takes to catch it - typically exceeds the cost of getting the process right the first time.
Monstrousmediagroup builds the systems behind your test results
Most CRO programs stall not because teams lack test ideas, but because winning variants never get implemented, results never feed back into ad creative, and the test registry lives in one person’s spreadsheet. Monstrousmediagroup solves the operational layer, not just the experiment layer.

Through MonsterWP managed infrastructure, Monstrousmediagroup handles variant implementation, performance monitoring, and post-test rollout so winning results go live without a development queue. The digital marketing services team connects experiment outcomes directly to PPC campaigns, lead routing, and marketing automation - closing the loop between what your test proved and what your revenue system does with that proof. For businesses running paid search, the SEO and SEM integration protects organic rankings during experiments while ensuring paid traffic lands on the highest-converting variant. The next step is a structured CRO audit: a prioritized test plan built from your actual analytics data, not a generic checklist. Request yours at Monstrousmediagroup.
Authoritative resources for deeper study
- Evan Miller’s A/B test sample size calculator: the clearest explanation of how baseline conversion rate, MDE, confidence, and power interact to determine required traffic.
- Harvard Business Review on the power of online experiments: the definitive case for experiment-first culture and the operational discipline that separates valid tests from noise.
- Microsoft Clarity: free session recordings and heatmaps with no traffic limits, direct GA4 integration, and no sampling - the fastest way to add qualitative context to any test program.
Sources
- Landing Page A/B Testing in 2026: What to Test, in What Order | PulseCRO
- The surprising power of online experiments | Harvard Business Review
- Sample size calculation for A/B testing | Evan Miller
- Microsoft Clarity
- Elido