
Fix your server response time first, then make your largest content element load fast, then break up JavaScript that blocks interaction, then stop layout shifts with sizing attributes. That order matters more than any individual tweak. Once you deploy changes, expect Google Search Console to need a full 28-day window before its Core Web Vitals report confirms the fix actually stuck.
TL;DR:
- Prioritize fixing server response time and image payloads first, as they significantly impact LCP and overall core web vitals performance.
- Avoid lazy-loading above-the-fold images and ensure all images and videos have explicit size attributes to prevent layout shifts.
- Break up long JavaScript tasks and defer third-party scripts to improve interaction delays and reduce the likelihood of exceeding 200 milliseconds INP.
- Use explicit size reservations, font display strategies, and CSS techniques to stabilize layout shifts and meet CLS thresholds.
- Regularly monitor improvements through Search Console’s 28-day window and prioritize ongoing infrastructure fixes like caching, CDN, and server response times.
Table of Contents
- Quick Prioritized Checklist: 8 Fixes to Apply Now
- LCP Fixes: Make the Largest Element Load Fast and Early
- INP Fixes: Find and Break Long Tasks, Defer and Modularize JavaScript
- CLS Fixes: Stabilize Layout With Sizes, Reserves, and Font Strategies
- Foundation Fixes: TTFB, Caching, CDN, and Server Settings
- Platform Quick Wins: WordPress, React/Next.js, and SPA Traps
- How to Verify Fixes and Monitor Progress
- Monstrous Media Group: A Systems-First Approach to Performance and Revenue Protection
- Core Web Vitals Fixes: Practical, Prioritized Fixes for Site Owners
- Get Core Web Vitals Fixed and Monitored, Not Just Patched Once
- Sources
Quick Prioritized Checklist: 8 Fixes to Apply Now
Most sites failing Core Web Vitals have the same handful of problems. Here is the order that produces the fastest measurable gains, ranked by effort versus payoff.
- Preload the LCP resource. Add
fetchpriority="high"to your hero image or<link rel="preload">for a critical font. Fifteen minutes, no developer required if you’re on a CMS with header script access. - Remove lazy-loading from above-the-fold images. Lazy-loading your Largest Contentful Paint element delays it. Site admins can fix this directly in most page builders.
- Add explicit width and height to every image and video. This single change eliminates most layout shift complaints. Developer or admin, depending on your template setup.
- Defer third-party scripts (chat widgets, ad tags, analytics pixels) until after page load or user interaction. Requires developer access to your tag manager or theme files.
- Convert hero images to WebP or AVIF. Cuts payload size dramatically and moves LCP forward. A developer or a competent image plugin can handle this.
- Audit and reduce redirect chains. Every hop adds latency to your Time to First Byte. Developer task, usually a quick fix.
- Set font-display to swap or optional and preload your primary font file. Prevents invisible text and reduces shift from font swapping. Developer task.
- Break up long JavaScript tasks over 50 milliseconds using
scheduler.yield()or asetTimeoutfallback. This is the heaviest lift on the list and requires real development time.
Pro Tip: Run PageSpeed Insights before touching anything, save the report, then re-run it after each individual fix instead of batching five changes at once. You will not know which change actually moved the needle if you deploy them all together.
Tasks one through three are the fastest wins on this list. Tasks six through eight require a developer who understands your codebase, not a plugin.
LCP Fixes: Make the Largest Element Load Fast and Early
Google’s threshold for Largest Contentful Paint is 2.5 seconds or faster at the 75th percentile of page loads. Everything below is about hitting that number, not defining it.
Start with discoverability. Browsers can only prioritize a resource they know about early, which is why the biggest LCP wins come from telling the browser what matters before it starts parsing the rest of the page. Two tools do this:
fetchpriority="high"on your hero<img>tag tells the browser to fetch that image ahead of lower-priority requests, and MDN’s documentation on the fetchPriority attribute covers exactly how browsers interpret it.<link rel="preload" as="image" href="/" fetchpriority="high">in your document head works when the image is set via CSS background rather than an<img>tag, which fetchpriority alone can’t reach.
Use fetchpriority when you control the HTML markup directly. Use preload when the LCP element is loaded through CSS, a font, or a script-injected background. Never lazy-load whatever qualifies as your LCP element. Lazy-loading tells the browser to wait until the element is near the viewport before fetching it, which is the opposite of what you want for the first thing a visitor sees.
Your image pipeline matters just as much as the priority hints. Convert hero images and above-the-fold graphics to WebP or AVIF, serve responsive versions with srcset and sizes so mobile visitors don’t download a desktop-sized file, and compress aggressively. Converting images to modern formats through a proper pipeline typically cuts payload by 30 to 70 percent, which often moves LCP forward by 300 to 1,000 milliseconds on its own. Monstrousmediagroup’s guide on optimizing images for SEO walks through the srcset and compression settings in more detail.
None of this matters if your server takes too long to respond in the first place. LCP timing includes Time to First Byte, so a slow origin server or an overloaded database query delays every downstream optimization, no matter how well you’ve compressed your images.
Statistic Callout: The three highest-impact LCP actions, according to Pagespeed Matters’ remediation guide, are preloading or prioritizing the LCP resource, converting and compressing images, and eliminating render-blocking resources. Sites that tackle all three typically see the largest single-visit improvement of any Core Web Vitals category. LCP also happens to be the metric that fails most often across the web, which is exactly why it sits first on this list.
INP Fixes: Find and Break Long Tasks, Defer and Modularize JavaScript
Google’s target for Interaction to Next Paint is under 200 milliseconds. Anything slower and visitors feel the lag between clicking something and seeing a response, even if they can’t articulate why the page feels sluggish.
Detection comes before remediation. Open Chrome DevTools, go to the Performance tab, and record an interaction like a menu click or an “Add to Cart” tap. Look for tasks longer than 50 milliseconds in the Main thread track. Real User Monitoring traces from your analytics stack will show you which pages and which interactions are worst in the field, which matters more than a single lab test because INP varies by device and by what a visitor actually clicks.
- Break up long tasks with
scheduler.yield(), falling back tosetTimeout(fn, 0)for browsers that don’t support it yet. Web.dev names this pattern as the modern standard for INP remediation, replacing the older approach of just deleting scripts and hoping for the best. Yielding lets the browser paint and respond to input between chunks of your JavaScript instead of running it all in one uninterruptible block. - Code-split your JavaScript bundles so pages only load the logic they actually need, using dynamic imports for anything not required on initial render.
- Reduce unnecessary DOM updates. Batching state changes instead of triggering a re-render on every keystroke or scroll event cuts main-thread work significantly.
- Delay third-party scripts until interaction or idle time. Chat widgets, review plugins, and ad tags rarely need to load before a visitor does something. A local proxy for scripts you can self-host removes the third-party request chain entirely.
The technical detail that trips up most teams: INP problems are rarely solved by deleting code. MDN’s reference for scheduler.yield shows how the API restructures synchronous work into interruptible chunks, which is the real fix, not a workaround.
Pro Tip: Prioritize interactive elements first, meaning buttons, form fields, and navigation menus, since those are what Interaction to Next Paint actually measures. A slow-loading footer widget matters far less than a sluggish “Submit” button. Confirm your fixes against Real User Monitoring data, not just a single Lighthouse run, since INP is heavily dependent on the visitor’s device and connection.
CLS Fixes: Stabilize Layout With Sizes, Reserves, and Font Strategies
Cumulative Layout Shift needs to stay at 0.1 or below. This is the cheapest metric to fix on this entire list, and most sites fail it for reasons that take minutes to correct once you know where to look.
- Add explicit
widthandheightattributes to every<img>and<video>tag, or use CSSaspect-ratiowhen the image is responsive and the exact pixel dimensions vary. - Reserve space for ad slots and embedded content (YouTube videos, social posts, maps) with a fixed-height container before the content loads, not after.
- Give cookie banners and promotional overlays a fixed position that doesn’t push page content when they appear, or better, have them overlay rather than displace.
- Preload your primary web font and set
font-display: swaporfont-display: optionalto control how visible text behaves while the font loads. Pair this withsize-adjustin your@font-facedeclaration to match the fallback font’s metrics to your web font, which prevents the visible reflow that happens when a wider or narrower font swaps in.
Statistic Callout: Adding width and height attributes to images is one of the fastest fixes on the entire Core Web Vitals checklist, according to Pagespeed Matters, and it commonly resolves the majority of CLS complaints on a typical content site without touching a single line of JavaScript.
Dynamic content is the harder case. If your page injects a promotional banner, a recommendation widget, or a newsletter signup after initial load, that content needs a reserved container from the start. The browser doesn’t know how tall an element will be until it renders, so give it a minimum height in CSS before your script populates it.
Foundation Fixes: TTFB, Caching, CDN, and Server Settings
Time to First Byte is the floor under every other metric. If your server takes 800 milliseconds to respond, no amount of image compression gets your LCP under 2.5 seconds. Aim for TTFB under 400 milliseconds, with under 200 milliseconds as the target for a well-tuned setup.
- Put your site behind a content delivery network. Distributing static assets and cached HTML across edge locations closer to visitors cuts the physical distance data has to travel, and modern CDN infrastructure paired with HTTP/3 meaningfully lowers connection latency for geographically spread audiences.
- Enable compression (Brotli or gzip) on every text-based response.
- Eliminate redirect chains. Each hop adds a full round-trip before the browser even starts downloading your page.
- Cache HTML with short expiration and revalidation, and cache immutable assets like versioned JavaScript and CSS files for a year or more.
If your origin server still struggles after these changes, hosting infrastructure itself is often the bottleneck. A partner like AceRDP’s high-performance VPS hosting addresses the server-side latency that no amount of front-end tuning can fix. When a site’s traffic or complexity outgrows shared hosting entirely, that’s the point to look at managed infrastructure built specifically around performance, rather than layering another caching plugin on top of an undersized server.
Platform Quick Wins: WordPress, React/Next.js, and SPA Traps
Different platforms fail Core Web Vitals for different reasons, and the fix that works on one stack can be irrelevant on another.
- WordPress: Audit every active plugin for scripts loaded on pages that don’t need them. Dequeue unused CSS and JS from your theme’s functions file. Check that your image optimization plugin isn’t lazy-loading the hero image by default, which several popular plugins do out of the box.
- React and Next.js: Prefer server-side rendering or streaming over pure client-side rendering, since a blank page waiting for a JavaScript bundle to hydrate is a direct hit to LCP. Use partial hydration where the framework supports it, and reach for dynamic imports on anything below the fold.
- Shopify-style and SPA platforms: Audit installed apps the same way you’d audit WordPress plugins. Each app injects its own script, and most storefronts run far more than they need. Where the platform allows it, favor theme-level optimization and server-rendered pages over heavy client-side app scripts.
Monstrousmediagroup’s notes on speed tactics for agency and lead-generation sites cover platform-specific triage in more depth if you’re managing a mixed stack.
How to Verify Fixes and Monitor Progress
Run PageSpeed Insights immediately after deploying a fix and save the lab score as your baseline. Lab data is useful for fast iteration, but it’s a single simulated load, not what real visitors experience.
- Field data from the Chrome User Experience Report and your own Real User Monitoring reflects actual visitor conditions, which is why Search Console leans on CrUX rather than lab scores for pass/fail decisions.
- Open the Core Web Vitals report in Search Console and click “Start tracking” on the URL group you just fixed.
- Expect a full 28-day rolling window before Search Console shows whether the fix held, per Google’s own guidance on fixing page experience issues.
- Prioritize high-traffic URL templates first. Fixing your product page template affects far more sessions than fixing a single blog post.
Re-run Lighthouse after every deploy, but treat the 28-day Search Console window as the real verdict, not the lab score.
Monstrous Media Group: A Systems-First Approach to Performance and Revenue Protection
Slow pages don’t just hurt rankings. They lose leads before a visitor ever sees your offer, which makes Core Web Vitals a revenue protection problem as much as an SEO one. Monstrousmediagroup treats performance as infrastructure, not a one-time cleanup project.
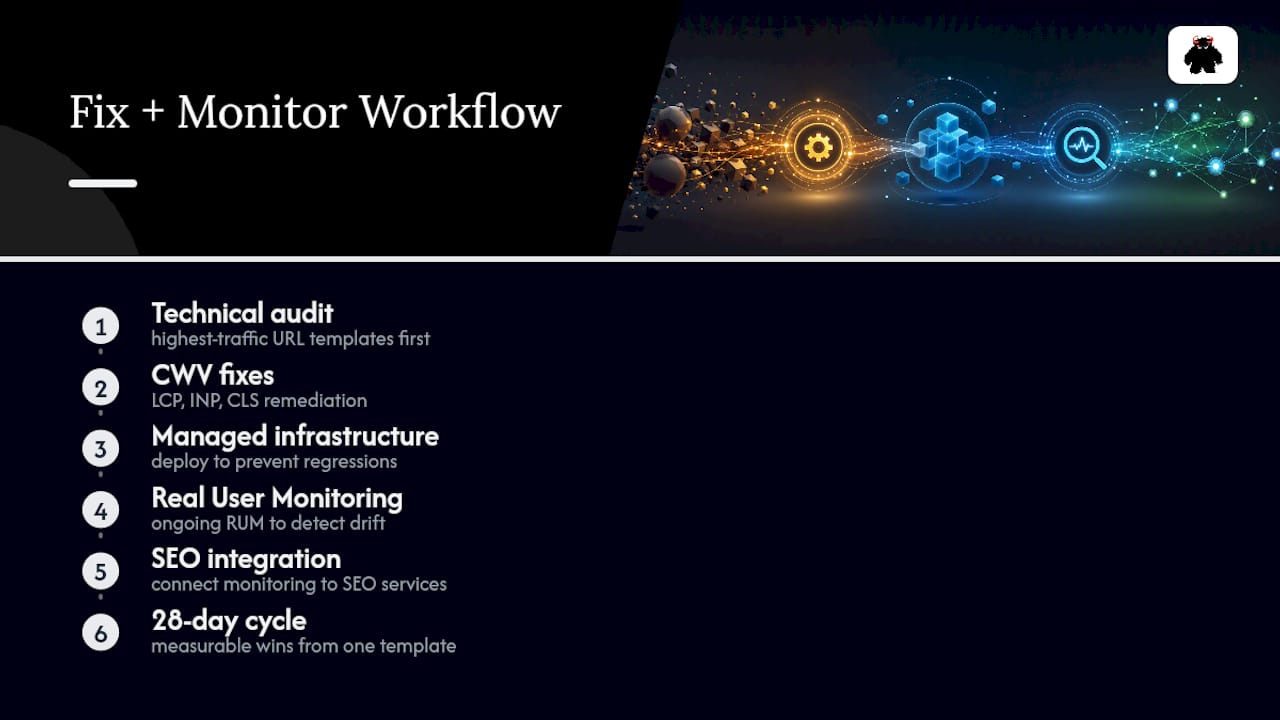
The operational cadence looks like this: audit the failing URL groups, apply the quick wins from the checklist above, fix server and caching infrastructure through managed hosting environments like MonsterWP, refactor the JavaScript causing INP failures, then move into ongoing Real User Monitoring paired with SEO/AEO/GEO visibility checks. Each phase maps to a service, and each phase feeds the next. A site that stays fast keeps converting the traffic your visibility systems are working to earn.
Core Web Vitals Fixes: Practical, Prioritized Fixes for Site Owners
The conventional advice treats Core Web Vitals as a one-time audit: run a report, fix what’s red, move on. That framing misses the actual failure pattern. Sites regress. A plugin update reintroduces render-blocking scripts, a marketing team adds a new ad tag, a developer ships a feature that skips image dimensions, and three months later the same site fails the same metric it “fixed” earlier in the year.
What the evidence actually supports is treating Core Web Vitals as infrastructure that needs monitoring, not a checklist you complete once. The Web Almanac’s finding that LCP fails more often than any other metric isn’t a one-time snapshot either. It’s a recurring pattern because most teams fix the symptom (a slow hero image) without fixing the cause (no caching strategy, no CDN, no monitoring to catch the next regression).
Prioritize the infrastructure layer first, even though it’s less glamorous than a clever JavaScript fix. A site with solid caching, a CDN, and Real User Monitoring in place catches regressions before Search Console’s 28-day window ever flags them.
- Vector
Get Core Web Vitals Fixed and Monitored, Not Just Patched Once
Most agencies hand you a PDF audit and disappear. Monstrousmediagroup builds the fix, the monitoring, and the follow-up into one engagement, so a plugin update or a rushed feature deploy six months from now doesn’t quietly undo the work.

The engagement starts with a technical audit of your highest-traffic URL templates, moves into the LCP, INP, and CLS fixes this article walks through, and continues with managed infrastructure and ongoing Real User Monitoring so performance stays fixed instead of drifting back into red. That monitoring layer connects directly to Monstrousmediagroup’s SEO services, since a site that stays fast keeps the organic visibility your rankings depend on.
Pro Tip: Start with your single highest-traffic URL template, whether that’s your product page, your homepage, or your primary landing page, rather than trying to fix every page on the site at once. A narrow, high-impact remediation gets measurable results inside one 28-day cycle instead of spreading effort too thin to show up in Search Console at all.
Ready to see what’s actually costing you conversions? Request a Core Web Vitals audit from Monstrousmediagroup and get a prioritized fix plan built around your highest-traffic pages first.
Sources
For the official thresholds and measurement guidance, start with Google’s Core Web Vitals documentation and Web. Developers implementing the code-level fixes should reference MDN’s scheduler.yield documentation and MDN’s fetchPriority reference directly. For verification, Search Console’s guide to fixing page experience issues explains the 28-day tracking window in full. Monstrousmediagroup’s own posts on speed tactics and image optimization cover implementation detail this article only summarizes.
- Fixing page experience issues (Search Console help)
- Understanding Core Web Vitals and Google search results (Google Developers)
- Web Almanac 2024 - Performance